The following remarks are a transcript of the second part of a presentation made last week by Delia Grace, who works at the International Livestock Research Institute (ILRI), in Nairobi. Grace, a Irish veterinary epidemiologist, leads ILRI’s research on food safety in informal markets in developing countries and on ‘zoonoses’—diseases shared by animals and people. Grace also leads a component on agriculturally related diseases of a new multi-centre CGIAR Research Program on Agriculture for Health and Nutrition, which is headed by John McDermott, former deputy director general-research at ILRI, who is now based at ILRI’s sister CGIAR institute the International Food Policy Research Institute (IFPRI), in Washington, DC, USA. Grace is also a partner in another multi-institutional initiative, called Dynamic Drivers of Disease in Africa.
A prolific writer of scientific publications and a scientist of particularly wide research interests, Grace began her ‘big-picture’ talk on zoonoses—on why, and if, they are ‘the lethal gifts of livestock’—with an overview of human health and disease at the beginning of the 21st century. Go here to read part one: The riders of the apocalypse do not ride alone: Plagues need war, famine, destruction–and (often) livestock, ILRI News Blog, 4 Nov 2012.
Here we begin part two of this ILRI ‘livestock live talk’ presentation by Delia Grace on ‘The lethal gifts of livestock’.
Getting a handle on why zoonotic diseases matter, to whom and how much
‘So, we’ve discussed the links between livestock and disease and why livestock play such an important role in human disease. The next question we have to ask is to try and put some details on this, to put some parameters on it. So, if disease matters, and if animals have a big role in disease, what disease matters? How much? To whom? What does it cost? And what can we do about it?
‘In thinking through this, we tend to think at ILRI of different categories, which help us get more of a handle on some of the details. So we talk about the neglected zoonoses; these are the diseases like TB, brucellosis, cystercicosis—diseases that have been eradicated anywhere people have money and care, but persist—hang on—in poor countries. We talk about emerging infectious diseases—the BSEs, the SARS, the bird flus, Rift Valley fever, blue tongue—diseases that are changing their patterns and becoming more important. Then the food-borne diseases are the other big category. This is the single-most important. If you’re interested in human health and human death, food-borne diseases are the single-most important category. And finally, there are the other health risks in agro-ecosystems: How we farm and what this means for our health and nutrition.
Let the mapping begin
‘I now want to talk about some recent work we did on mapping poverty, zoonoses and emerging livestock systems in order to get a better handle on some of these questions about why it matters, who it matters to, how much it matters, and what we should or could do about it.
‘I’m going to present some work that was commissioned by DFID [the UK Department for International Development]. These were two systematic reviews that DFID asked us to do. The aim of these was to present data and expert knowledge on poverty and zoonoses hotspots in order to prioritize areas, to target areas, where prevention of zoonotic diseases can bring the greatest benefits to poor people.
‘This study took us down some interesting paths and some interesting conclusions. I’m going to talk about them in a little bit of detail.
‘So, the methods. What we wanted to do was to update global maps of poor livestock keepers. The first ever global map of poor livestock keepers was produced by ILRI around 10 or 15 years ago, again commissioned by DFID. This, I would say, was a landmark map. We also wanted to map rapidly emerging livestock systems. And here we drew a lot again on ILRI’s expertise, especially Mario Herrero’s group, which have been doing a lot of big-picture work on changes in livestock systems—what’s happening, where it’s happening and why it’s driving change. We also wanted to update one of the most iconic maps for people in the zoonoses community, and this is the map by Kate Jones on emerging infectious diseases that appeared in Nature about ten years ago (and everywhere else since).
‘We wanted to identify which were the most important zoonoses for poor people. You’d think that we’d know that, but what we find is that we have a dozen definitions and none of them agree. And then, finally, we wanted to develop the first global mapping of where zoonoses, poverty and emerging [livestock] systems come together to make hotspots, for maximum investments, for maximum bang for the buck.
Where are the poor livestock keepers?
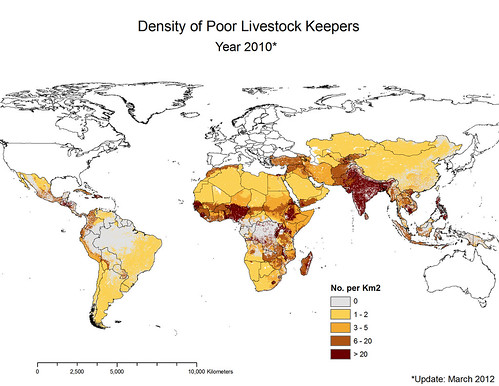
Update in 2012 by ILRI’s Delia Grace of map by ILRI’s Phil Thornton showing density of poor livestock keepers (map credit: ILRI/Philip Thornton).
‘Here is the updated map of poor livestock keepers. I think you can see by looking at it that it’s focal. The dark areas represent high density. South Asia jumps out at us. And in Africa we see the ‘magic 7’, from the coastal regions of West Africa to Nigeria and up through the highlands of Ethiopia and right down the Rift Valley through Uganda and northern Tanzania and right down to Malawi.
‘So what can we say in our updating of poor livestock keepers?
One billion poor livestock keepers depend on 19 billion livestock. Most of the livestock in the world are owned by poor people: 24 billion in total in the world and 19 billion in poor countries. That’s a lot of opportunities for disease to spill over, 19 billion animals.
What’s more, the ‘parietal law’, the law of ‘the vital few and the trivial many’, applies. Just 4 countries have 44 per cent of poor livestock keepers. All countries are not equal.
‘Livestock matter a lot: 75% of rural people, and 25% of urban people, depend on livestock. Now ‘depend’ is one of those weasel words that we keep being asked to shine more light on. We don’t know enough—it’s amazing how little we know despite how important this is—but our best guess for now is that when we say ‘depend’ we mean that livestock contribute between 2 and 33% of household income and 6 to 36% of protein. It’s not trivial.
Where are the fast-evolving livestock production systems?

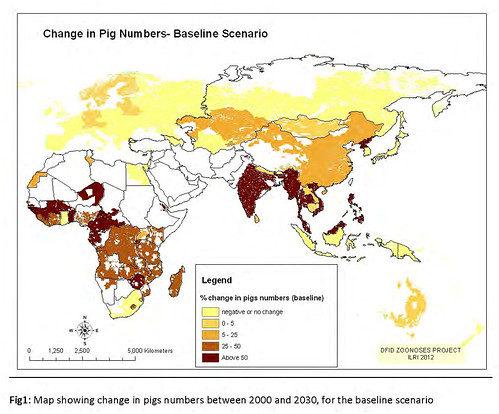
2012 maps showing changes in poultry and pig production between 2000 and 2030 (map credit ILRI/Delia Grace).
‘The second map we updated was these emerging livestock systems. As we suspected, most emergence is happening in the monogastrics, the pigs and the poultry. And of course this has been known since the landmark papers on the livestock revolution. Our maps confirm this; we’re getting a lot of change in pigs and poultry, and again it’s focal; you can see that it’s not uniform.
‘So in summary, where are we getting massive, rapidly changing systems? Big changes in numbers? Big changes in baselines? Where do we have people who don’t have a lot of experience doing this sort of farming now doing it in a big way? (Once you get naïveté along with massive intensification, you get problems.)
Poultry in several places on all continents, bovines in South and East Asia, and pigs in sub-Saharan Africa. These are the rapidly emerging livestock systems.
Where are the emerging infectious diseases?
‘Next, we updated the emerging infectious diseases map. This was a study that was originally done by Jones et al. based on all emerging diseases from 1940 to 2004. What we wanted to do was to focus just on zoonotic diseases (the 75% of all human disease that are zoonotic) and also to update it with data from 2004 to 2012.

Map by IOZ, published in an ILRI report to DFID; Mapping of Poverty and Likely Zoonoses Hotspots 2012.
‘All of these dots represent new, potentially scary, diseases. The bigger the dot, the more the outbreaks. The new diseases are the blue circles; they are the ones that happened in the last ten years. The brown are the old; those are the ones that happened in the 70 years before. Again you can see a pattern here, but it’s not the same pattern we saw in the other map.
‘What we see is that western USA and western Europe are the hotspots for disease emergence. There’s a reporting bias in here, but we believe that this is not just reporting bias but actually represents emerging events. Interestingly, the blue events, the new events, are more common in South America and Southeast Asia, as intensification takes off in these regions and start to look more like intensive [livestock] systems of the West.
Multiple disease burdens are ‘where it’s at’
‘So, what are the high-priority zoonoses? We were interested in multiple [disease] burdens. One of the things we believe leads to bad management of zoonoses is that it’s done sectorally; it falls between lots of chairs. The World Health Organisation thinks about the human burden. The United Nations Food and Agriculture Organization thinks about the animal burden. Other people think about the wildlife burden. But people too rarely get together and think about the multiple burden.
What isn’t measured isn’t managed. And we think that one great step forward is just having people think about multiple burdens. So our listing, our criteria, consists of looking at the burdens across human health, animal health and ecosystems health.
‘From lots of listings, we assessed 56 zoonoses and found that together they caused a lot of problems. But the ones that were most important tended to have a wildlife interface, had a major impact on livestock and were amenable to on-farm agricultural interventions.
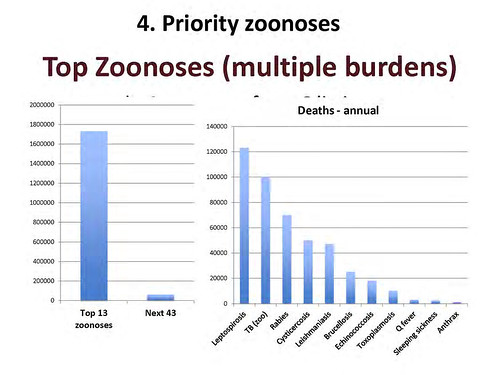
Slide of ‘top zoonoses’ from ‘livestock live talk’ presentation, ‘Zoonoses: The Lethal Gifts of Livestock’, made by Delia Grace on 31 Oct 2012.
‘Just to give you some idea of the numbers, there are about 600 zoonoses and we looked at the top 50. Of that top 50, this is the human death caused by the top 13 and that by the next 43. Again, I think you can see it’s a case of the vital few and the trivial many. If you’ve got scarce resources and care about human death, you invest in the top 13, not in the bottom 43.
And here it is just broken out by individual zoonoses, and even in that top 13, you can see that there’s a difference between big killers and little killers. And sometime the ones we hear most about—and worry most about—are the ones that kill least.
‘The first thing we did then was to go to official reporting systems to try to find out where these zoonoses were and how these linked to the other things we were mapping. There are several reporting systems. There’s one by OIE [World Organisation for Animal Health], which is ‘notifiable’, that is, every OIE member has to report all their animals that die of notifiable diseases (you’d think that was easy enough). There’s also one run by FAO, and there’s Pro Med, there’s GEWS, and there’s Health Map, which is an aggregator. That a picture of Health Map, and it’s a pretty exciting innovation. A ‘bot’ trawls the web and captures all the information on diseases.
When we put all of these [official disease reporting systems] together, what we found was that they were completely useless. They told us almost nothing about the burden of diseases. They told us about exciting things, interesting things. When a kid in Buenos Aires got bitten by a rabid dog, that showed up here. But when we were interested in what is sickening and killing billions and millions of people, it was just hopeless.
‘Just to give you an example, Africa has about 250 million tropical [aggregated] livestock units; we know that around 25 million of them die prematurely every year. We estimate around half of those deaths are due to notifiable diseases. There are over 60 notifiable diseases and pretty much everything falls into these. And what’s reported? Say 10 million dead, 80,000 reported.
This isn’t just under-reporting; this is a reporting system that is not very helpful!
‘So we couldn’t use the official reports. And it’s a huge weakness. People go along blindly and mechanically collecting this data, sending it in to OIE, doing complicated analyses showing all the different effects and impacts of these diseases, but they fail to take into account that they’re only looking at the 80,000 that are reported, and not the 920,000 that are not reported. It’s sort of an exercise in futility.
‘So what we did instead was a systematic literature review. We found that the only way we could get some sort of handle on where these zoonoses are was just to keep looking through the literature, pulling it out—grey, white, published, local language—and get as many surveys as we could and geographically map them and see what they are doing. In fact, we got over a thousand studies, which was enough to get some sort of a spatial understanding.
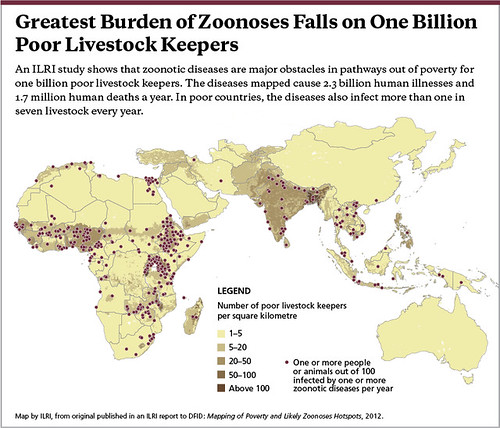
Map by ILRI, published in an ILRI report to DFID: Mapping of Poverty and Likely Zoonoses Hotspots, 2012.
‘This is what we came up with. Where you see a dot is where 1 or more people or animals in 100 are affected by 1 or more diseases per year. At least a 1%, at least 1 in 100 are sickened or killed. The dark colour shows where the poor livestock keepers are. Again, you can see the ‘7’ in Africa, whereby the zoonoses are linked to the poor livestock keepers. You can see quite a bit in South Asia and some in Southeast Asia.
‘There is a definite link between livestock keeping and poverty, which is what we suspected, but here again there is a lot of under reporting.
An unlucky 13 zoonoses sicken 2.4 billion people and kill 2.2 million people and they affect more than 1 in 7 livestock each year. These numbers are not trivial. These are large numbers, large numbers of sickness and death.
Our zoonotic problems are big problems
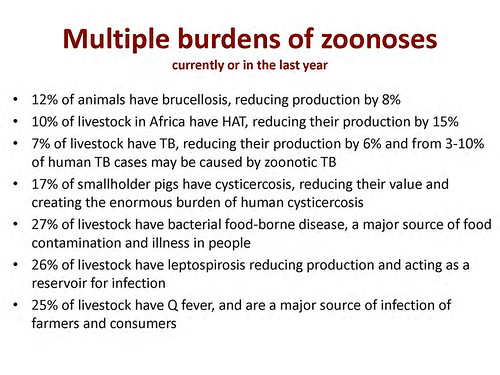
Slide of ‘multiple burdens of zoonoses’ from ‘livestock live talk’ presentation, ‘Zoonoses: The Lethal Gifts of Livestock’, made by Delia Grace on 31 Oct 2012.
‘As I said, we focused on multiple burdens of zoonoses, and here are some. I won’t read through them in detail, but again, going across all of these surveys, the numbers are frighteningly high. Round about 10% of animals have brucellosis, which is a serious disease in people, causing ungulant fever, infertility in men; it can cause psychosis and depression. And it’s transmitted in milk. If you don’t boil your milk, 1 in 10 animals has brucellosis. Ten per cent of animals in Africa have tryps [African animal trypanosomiasis], reducing their productivity by 15%. With 250 million livestock units, say they’re worth USD500 each, and you reduce their productivity by 15%—we’re talking large numbers here. TB, cysticercosis, bacterial food-borne disease, all of these came up.
‘The bad news is that it’s there and it’s a big problem in animals as well as people. The good news, of course, is that this provides incentive-based ways of tackling some of these zoonoses. Because if you can manage your animal zoonoses and boost your productivity by 10 or 20%, there’s a strong incentive for you to do it. What we’ve found with these studies (and we’ve been doing a lot of them over the years), is that too often the human health attitude is that people should do this because it’s good. You should do it to protect your own health. You should do it to protect the consumer’s health. That is one of the weakest motivations of all. How many things do we not do even though we know they’re good for our health? And how many fewer things do we do if they’re not good for our health but they’re good for someone else’s health?
Give people incentives, not rules, to better manage disease
‘What we find in these informal markets, where regulation is a joke and you have a hundred vets in a country and a hundred million animals, there’s no point in regulations or officials telling people “You should do this because it’s good for you”. It has to be incentive-based. People have to see a real benefit from changing their behaviour, either in their pocket or in their social status. And it doesn’t have to be money. We found people will change their behaviour just as much if they can get a social kick out of it. If instead of being a low-status person they get to be a high-status person, they’ll change their behaviour.
‘So, in summary what did we find? There are definite [zoonotic] hotspots, which is good, because that’s what the donor wanted because that’s where the donor wants to invest. This is also a nice example of how science can generate evidence that is asked for by a donor and then influences donor behaviour, so it’s a virtuous cycle.
Where the ‘perfect storms’ lie
‘Poor livestock keepers? South Asia is the biggest. Emerging livestock systems? Again, South Asia. Zoonotic emerging infectious diseases? Western Europe and USA. Zoonoses? South Asia and central and eastern Africa.
If we are to name six countries where all of these come together, where you get the ‘perfect storm’ conditions, they are India, Bangladesh and Pakistan in Asia; Ethiopia, Nigeria and Congo in Africa.
‘So we’ve talked a bit about the big picture, human health and disease in the 21st century and why livestock matter. I’ve presented some of these findings of our mapping studies trying to get some evidence: the evidence that decision-makers want in a format they can use, in a way that motivates them to invest money.
‘But now, finally, I want to talk a bit about how we move from mapping to managing. . . .’
Notes
This ends part two of the seminar by Delia Grace. Look on this ILRI News Blog for part three in a couple of days’ time.
Part one of this seminar is here: The riders of the apocalypse do not ride alone: Plagues need war, famine, destruction–and (often) livestock, ILRI News Blog, 4 Nov 2012.
View the slide presentation, which is a ‘slidecast’ that includes an audio file of the presentation by Grace: Zoonoses: The lethal gifts of livestock, an ILRI ‘livestock live talk’ by Delia Grace at ILRI’s Nairobi headquarters on 31 Oct 2012.
Read the invitation to this ILRI ‘livestock live talk’, and sign up here for our RSS feed on ILR’s Clippings Blog to see future invites to this new monthly seminar series.