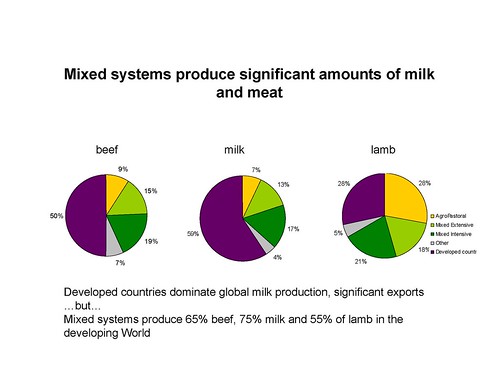
Mixed crop-livestock systems in the developing world produce significant amounts of milk and meat (figure credit: ILRI/Herrero, 2010).
A new book years in the making on the seemingly abstruse topic of ‘livestock system classifications’ has just been published by the United Nations Food and Agriculture Organization (FAO) and the International Livestock Research Institute (ILRI).
To find out why classifying livestock systems is not an academic matter (hint: it can help fill the gap between the potential and actual yields of our food production systems), but rather matters rather urgently, particularly to the futures of more than 1 billion poor people who depend on livestock for their livelihoods, read on. And note that the book includes lots of new maps to pore over.
Global datasets are becoming increasingly important for priority setting and targeting by organizations with a global mandate for agriculture and agricultural research for development in developing countries. Until now, the best estimates of livestock production systems were those produced by ILRI in 2002. These have now been updated and improved upon by FAO and ILRI.
What’s the book about? From the blurb
‘Informed livestock sector policy development and priority setting is heavily dependent on a good understanding of livestock production systems. In a collaborative effort between the Food and Agriculture Organization and the International Livestock Research Institute, stock has been taken of where we have come from in agricultural systems classification and mapping; the current state of the art; and the directions in which research and data collection efforts need to take in the future.
‘The book also addresses issues relating to the intensity and scale of production, moving from what is done to how it is done. The intensification of production is an area of particular importance, for it is in the intensive systems that changes are occurring most rapidly and where most information is needed on the implications that intensification of production may have for livelihoods, poverty alleviation, animal diseases, public health and environmental outcomes.
‘A series of case studies is provided, linking livestock production systems to rural livelihoods and poverty and examples of the application of livestock production system maps are drawn from livestock production, now and in the future; livestock’s impact on the global environment; animal and public health; and livestock and livelihoods. . . .’
Why this book? From the Introduction
‘Many organizations are involved in assembling and disseminating global spatial datasets that can be used for a wide variety of purposes. Such datasets are becoming increasingly important for priority setting and targeting by organizations with a global mandate for agriculture and agricultural research for development, such as the United Nations (UN) Food and Agriculture Organization (FAO), the international centres of the Consultative Group on International Agricultural Research (CGIAR), regional and subregional research organizations, and donors who need to target their investments and measure their impacts on beneficiaries. The world in which we live is extremely dynamic, and this is reflected in the ways in which the world feeds itself and people meet their livelihood requirements. There can be considerable heterogeneity in the determinants of rural poverty (Snel and Henninger, 2002; Kristjanson et al., 2005). An implication of this is that poverty alleviation efforts increasingly need to be targeted at relatively small groups of people, and this calls for a finer grain in the definition of intervention domains than has perhaps been considered in the past.
‘Currently, one of the biggest gaps in the availability of global datasets is a spatial agricultural systems classification that provides appropriate detail on the distribution of crops and livestock in different places.
This publication addresses this gap by bringing together some recent developments in agricultural production system mapping and highlighting some of the difficult problems involved. The book also identifies further work that is required to develop a dynamic global agricultural production systems classification that can be mapped, ground-truthed, and refined through time. . . .
‘The outputs described here should find immediate application among development organizations, donors and research institutes, in targeting investment and technology or policy interventions that are effective in promoting sustainable livelihoods of the poor in developing countries.
Why map livestock production systems?
‘Farming of crops and livestock cannot be considered independently of one another nor should they be considered in isolation. Established links between livestock numbers, cultivation levels and human populations suggest that greater attention should be paid to quantifying and mapping these associations (Bourn and Wint, 1994). The interdependence of crops and livestock in mixed farms and the different contributions made to livelihoods (Powell et al., 1995) suggest that these two aspects of farming should be considered together. The nature of such interactions is heavily shaped by environmental factors and, increasingly, by economic forces.
‘A detailed knowledge of the distribution of livestock resources finds many applications, for example, in estimating production and off-take, the impacts of livestock on the environment, livestock disease risk and impact, and the role that livestock plays in people’s livelihoods (Robinson et al., 2007; FAO, 2007a). But livestock is not all equal. In different contexts it serves quite different functions, plays different roles in people’s livelihoods, varies in herd structure and breed composition, and is fed and managed in different ways. For most applications some sort of practical stratification is needed: milk yields are not the same from cows reared in extensive, low-input pastoral systems as they are from specifically-bred dairy cows raised intensively. In the same way, the risks posed by livestock diseases vary considerably depending on whether animals are kept in high-density housing or grazed over large areas of rangeland, for example. At its simplest, combining information on production systems with livestock statistics allows livestock numbers to be disaggregated by production system (see, for example, the appendices in FAO, 2007a). Compared with simple national totals, this gives a more meaningful breakdown of how livestock are distributed across the globe. . . .’
What are the new numbers? From the conclusions
‘In terms of the numbers of poor and our estimates of the numbers of poor livestock keepers, based on national, rural poverty lines for 2010, the critical regions are still South Asia and sub-Saharan Africa. Some 71 percent of the estimated 430 million poor livestock keepers live in these two regions, up from 66 percent a decade earlier. While the rangeland systems contain relatively few poor, most of these households are dependent on livestock for their livelihoods. Half of the poor livestock keepers in rangeland systems globally are located in sub-Saharan Africa: nearly 60 million, based on national, rural poverty lines. The mixed systems contain large numbers of poor (over one billion), and the number of poor people who depend to some extent on livestock is considerable: the mixed irrigated and mixed rainfed systems are estimated to host more than 300 million poor livestock keepers based on national and international US$1.25 per day poverty lines, and double that many based on the international US$2.00 per day poverty lines.
‘Despite their obvious limitations and coarseness, the data presented on locations and densities of poor livestock keepers can still provide information of considerable use. The current information continues to be used at ILRI to prioritize and focus livestock research, and to help identify ‘hotspots’ at the global and regional levels that can then be investigated in more detail at higher resolution. Such hotspots can be defined in various ways depending on the purpose: as areas of high population densities of poor livestock keepers, or areas of high densities of poor people coupled with high levels of biodiversity or natural resource degradation, for example. Such information is critical for informing action agendas concerning livestock, development, and global change. . . .’
How did the book come about? From the foreword
‘This book has grown out of a long-standing collaboration between the Food and Agriculture Organization of the United Nations (FAO), and the International Livestock Research Institute (ILRI). It emerged from a meeting of international organizations held at the Earth Institute at Columbia University in 2004, at which FAO and the Consultative Group on International Agricultural Research were charged with closing a gap in our understanding of the distribution of agricultural production systems. The book took further shape following a workshop convened by FAO in Bangkok in 2006, during which the custodians of many of the key datasets needed to produce maps of global livestock production systems were brought together with experts and researchers in agricultural production systems. It brings together the results of several years’ of activity by FAO and ILRI, along with colleagues from the International Food Policy Research Institute, the International Institute for Applied Systems Analysis and many other organisations not explicitly linked to the production of the book.’
Download the whole publication here: Global livestock production systems, by TP Robinson, PK Thornton (ILRI), G Franceschini, RL Kruska (former ILRI), F Chiozza, A Notenbaert (ILRI), G Cecchi, M Herrero (ILRI), M Epprecht, S Fritz, L You, G Conchedda and L See, 2011, Rome: Food and Agriculture Organization of the United Nations (FAO) and International Livestock Research Institute (ILRI), 152 pp.