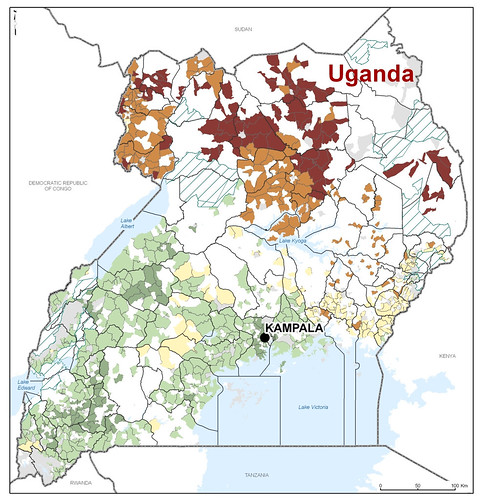
This map from Mapping a Better Future combines poverty rates with milk production data and shows only the poverty rates for administrative areas with milk surplus. By knowing which areas display both high poverty rate and milk surplus, Uganda’s leaders can better provide market opportunities for poorer dairy farmers and target infrastructure investments.
The percentage of the population living below the poverty line is shown from
>dark green (lowest) to > light green (low) to > beige (medium) to > tan (high) to > dark brown (highest).
Gray areas = no data
White areas = outside milk surplus area
Diagonal blue lines = major national parks and wildlife reserves (over 50,000 ha)
To see the original of this and other maps, go here.
A new
set of maps illustrating possible market
opportunities for Uganda’s livestock farmers living
in poverty is being unveiled today. The maps compare for the first time
2005 poverty levels with livestock data from the
2002 population and housing census and the 2008
national livestock census.
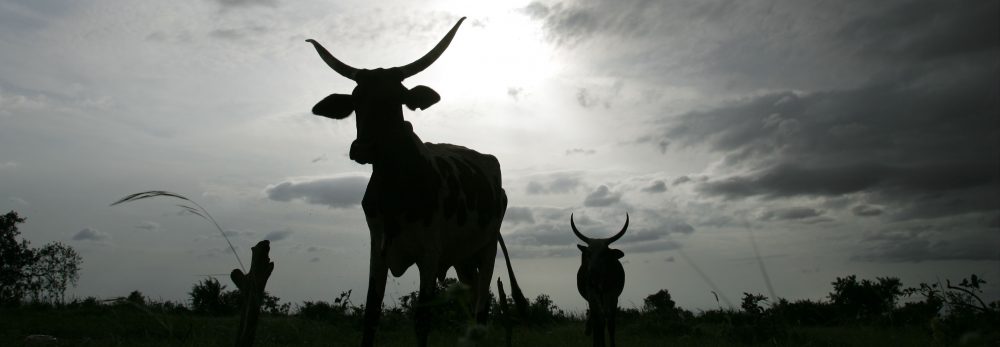
‘Seven out of ten households in Uganda own
livestock, making it an integral part of Ugandans’
diet, culture and income,’ said Hon. Hope R.
Mwesigye, Ugandan Minister of Agriculture,
Animal Industry and Fisheries and co-author of
Mapping a Better Future: Spatial Analysis and
Pro-Poor Livestock Strategies in Uganda. ‘The
maps are meant to guide the government’s future
investments to reduce poverty while strengthening
the livestock sector.’
Hon. Syda N.M. Bbumba, Uganda Minister of
Finance, Planning and Economic Development,
said, ‘Examining the spatial relationships between
poverty, livestock systems, location of livestock
services such as dairy cooling plants, and livestock
disease hotspots can provide new evidence-based
information to help craft more effective
investments and poverty reduction efforts.
While Uganda’s total agricultural output has declined, livestock figures have increased dramatically in the last
decade due to strong domestic and regional demand for livestock products, according to the report.
‘Increased livestock production carries both economic opportunities for Ugandans and greater risk for
transmission of animal diseases,’ said Nicholas Kauta, Commissioner of Livestock Health and Entomology at
the Ministry of Agriculture, Animal Industry and Fisheries. ‘The maps included in this report will help
Uganda’s leaders understand market opportunities and, at the same time, target at-risk areas for disease
outbreaks with appropriate health intervention plans.’
For instance, maps showing milk surplus and deficit areas can highlight geographic differences in market
opportunities for poor dairy farmers. According to the maps in the report, about 3.5 million people live in
sub-counties identified as producing more milk than their residents consume, and approximately 0.8 million
poor people live in areas where the demand for milk is greater than supply. This information can help
policymakers, dairy researchers and development agencies gauge market opportunities and invest in
infrastructure where it is needed the most.
‘By combining social data and livestock information and analyzing the map overlays, decision-makers from
different sectors can work together to identify solutions to complex problems facing communities such as
diseases that affect both people and livestock,’ said Norbert Henninger, senior associate at the World Resources Institute and co-author
of the report.
John B. Male-Mukasa, executive director of the Uganda Bureau of Statistics, said, ‘Uganda’s government
acknowledges the importance of livestock to the nation’s economic development and food security, and as
part of its 2010–2015 National Development Plan, it plans to invest in improved livestock breeds, water
infrastructure and livestock land management. The maps in this report will be useful in identifying the
regions where investment is needed most dearly.’
Mapping a Better Future is the third installment in a series of publications using maps and spatial analysis to
reduce poverty in Uganda, following two previous reports that targeted wetlands and water and sanitation.
Download the publication here.
The following institutions were involved in the production of this publication.
The Uganda Bureau of Statistics is the principal data-collecting, -processing, -analyzing, and -
disseminating agency responsible for coordinating and supervising the National Statistical System.
The World Resources Institute is an environmental think tank that goes beyond research to
find practical ways to protect the earth and improve people’s lives.