Electronic version of important poverty mapping book for Uganda available here

An electronic version of an important book, Where are the Poor? Mapping Patterns of Well-Being in Uganda, is now available.

Uganda has some of the poorest people in the world. For the first time, the question Where are the poor in Uganda? can be answered, as a result of sophisticated poverty maps developed by the Uganda Bureau of Statistics and the International Livestock Research Institute (ILRI). These maps provide facts and figures on poverty and inequality by region, district and county, highlighting where the poorest are located and estimating the numbers of poor and levels of poverty. These maps are important because they can be used to ensure that resources are targeted at those most in need.

If you are interested in viewing the entire electronic version of the book, click open:

If you are interested in viewing this book by chapter, go to:

To view the maps from the Atlas of Estimated Measures of Poverty Below the Regional Level: 1992 Poverty Maps, go to:

To view the maps from the Atlas of Estimated Measures of Poverty Below the Regional Level: 1999 Poverty Maps and the Change in Poverty from 1992 to 1999, go to:

Poverty pathways to be mapped across Kenya

The Kenya Government on 23 June 2005 announced that it has enlisted the Nairobi-headquartered International Livestock Research Institute (ILRI) to undertake an ambitious study investigating how, when and why Kenyan households move into and out of poverty. A deeper understanding of poverty dynamics can help developing countries better target and tailor pro-poor poverty interventions. ILRI has previously undertaken two similar studies on ‘Pathways out of Poverty and the Role of Livestock’, one in western Kenya and the other in Peru. These were undertaken in collaboration with the Pro-poor Livestock Policy Initiative of the Food and Agricultural Organization of the United Nations and Dr. Anirudh Krishna of Duke University, in the USA, who developed the participatory methods used in the study for similar research he first conducted in India. Remarkably, members of poor communities in India, Kenya and Peru all site the same factors that force households into poverty or help people climb out of poverty: loss or acquisition of livestock is, respectively, key to both. The new study in Kenya will be conducted across the whole country and will include all three of the country’s major livestock systems: pastoral, agro-pastoral and mixed crop-and-livestock production. The information on poverty will be collected in participatory ways and will be coupled with results of Kenya’s formal Welfare Monitoring Survey undertaken by the Ministry of Planning, ILRI’s partner in this new initiative, along with the Ministry of Agriculture. The breadth of the information obtained will allow scientists to answer a wide range of questions about poverty. The better understanding of poverty dynamics gained will help government policymakers and donor agencies better target and tailor pro-poor poverty interventions in this and other developing countries. The Kenya Government has awarded ILRI US$250,000 to undertake this study. 2004 Western Kenya Study: This study revealed that poor families move through six stages of progress out of poverty – from being able to secure food (stage one) to purchasing a sheep or goat (stage six). Fourteen stages were identified and these stages highlight the relative importance of livestock to the poor. The main findings are summarised in an ILRI Top Story. Click here to link to From Poor to Well-Off: Livestock can make a difference. Deep-seated customs can play a significant role in a family's descent into poverty and were identified as such by individuals surveyed. Raising awareness of the crippling effects of these customs, through a media campaign, could help get communities talking about the problems, and this could lead groups to actively seek solutions. The main findings are summarised in an ILRI Top Story. Click here to link to Funerals, Thefts and Bride Price: Livestock Loss Leads to Poverty. Click here to link to the full report Pathways out of Poverty in Western Kenya and the Role of Livestock. 2005 Peru Study: This study found that, overall, the number of households in poverty declined by 19% over 25 years in the 40 Andean communities studied. However, it also found that while some households escaped poverty, other households in the same communities fell into poverty and became poor. In addition to helping households escape poverty, stopping or at least controlling descents is essential to reducing poverty. The hole at the bottom must be plugged before there is any chance of filling the bucket. Else, households will continue slipping into poverty even as other households escape. Diversification of income sources – from livestock, crops and non-agricultural sources – are positively and strongly related to escapes from poverty. Market access, gains from small businesses, and community organizations are also positively and significantly associated with escaping poverty. On the other hand, health, land division, and social expenses (on marriages and funerals) tend to perpetuate poverty. Source: Excerpted from the draft working paper: The Hole at the Bottom of the Bucket: Household Poverty Dynamics in Forty Communities of the Peruvian Andes, Anirudh Krishna, Patti Kristjanson, Judith Kuan, Gustavo Quilca, Maren Radeny, and Alicia Sanchez-Urrelo

Smallholder dairy project

Award-winning dairy project reduces poverty through joint 'Action Research'. An award-winning eight-year collaboration has helped millions of Kenyans beat poverty and malnutrition. It’s done this through research on the country’s smallscale dairy workers. Modest dairy enterprises — comprising households milking one or two cows on tiny plots of land and young men hawking ‘raw’ (unpasteurized) milk that they transport on bicycles — make up an astonishing 85 percent of all the milk marketed in Kenya, one of the biggest per capita milk-producing and -drinking countries in the world. (Kenyan milk comprises 70 percent of total dairy production in East and South Africa.) Smallholder dairying creates regular incomes for hundreds of thousands of poor Kenyans and in addition is a big job creator, providing two full-time jobs for every 100 litres of milk produced. ‘Informal’ dairying thus dwarfs Kenya’s modern dairy sector. Nonetheless, this vast informal milk sector was, until recently, virtually ignored by national dairy policy, which viewed such trade illegitimate. Scientists conducting a ‘Smallholder Dairy Project’ combined scientific research, government policymaking, international development and social activism to bring about a shift to pro-poor dairy policymaking. The Smallholder Dairy Project was led by Kenya's Ministry of Livestock and Fisheries Development, jointly implemented by the Kenya Agricultural Research Institute and the International Livestock Research Institute (ILRI), and largely funded by the UK’s Department for International Development. These organizations succeeded in putting into practice ‘action research’ by working closely with government and regulatory bodies, the private sector, civil society organizations and the country’s formal and informal milk sectors. The Smallholder Dairy Project developed technologies such as disease-resistant fodder varieties, research-based guidelines for milk hygiene and a milk container affordable by the poor. Of greater import are the proposed national policy changes induced by the project’s research and now being written into the Kenya Dairy Act. These promise to create an enabling policy environment for ‘micro-sized’ dairy enterprises. As the Kenyan dairy industry was liberalized and expanded rapidly over the past decade, strong pressure was exerted on the government to insist that all milk sold be pasteurized to ensure the safety of the nation’s milk supply. That’s where research made the difference for the poor. Data obtained over the years by the Smallholder Dairy Project disclosed that almost all milk in Kenya is boiled by households before being consumed, indicating that raw milk represents no substantial public health hazard. This reliable information helped establish small dairy producers and milk traders as successful and credible agents in the eye’s of the country’s dairy policymakers and regulators, who are now, in the words of the permanent secretary in the ministry of livestock, ‘mainstreaming the raw milk market’. The new policies will, for example, allow Kenya’s informal dairy workers to be licensed, and thus brought into the formal economy for the first time. That’s good news for the country’s estimated 1.8 million informal milk producers and sellers. This project is helping to harmonize regional dairy policies through networks such as ASARECA’s Eastern and Central Africa Programme for Agricultural Policy Analysis. And the project’s approaches are being employed beyond the region, such as in the state of Assam, in northeastern India, where small-scale dairying, making up 97 percent of the dairy market, has potential to lift millions out of poverty.

VIP conference to revitalise Kenyan agriculture

ILRI poverty maps were snapped up at VIP conference to revitalise Kenyan agriculture held at Nairobi's Safari Park Hotel from 20-24 February 2005. Poverty maps pinpointing the greatest numbers and depths of poverty in Kenya and Uganda, as well as in the developing world as a whole, were snapped up at a major national conference on revitalizing agriculture in Kenya in February 2005. The maps were published by the Kenya-based International Livestock Research Institute (ILRI) and its partners, particularly the bureaux of statistics in Kenya and Uganda. The maps are available in print and CD-ROM versions from ILRI (g.kamau@cgiar.org) and on ILRI (www.ilri.org) and other websites. ILRI and partners published the poverty maps for Kenya in 2003, for Uganda in 2005 and for the developing world as a whole in 2002. These maps and their accompanying figures and analyses are proving key to work by Kenya, Uganda and other countries to reduce poverty and monitor progress towards meeting the Millennium Development Goals, particularly to halve world poverty by 2015, set by world leaders at the United Nations Millennium Summit in 2000. The ‘National Conference on Revitalizing the Agricultural Sector for Economic Growth’, which ran from 20–24 February 2005, was organized by the ministries of agriculture, livestock and fisheries, and co-operative development and marketing. It was held at Nairobi’s Safari Park Hotel and was officially opened by His Excellency the President of Kenya, President Mwai Kibaki, on 22 February. Some fifteen hundred agricultural experts in governmental, non-governmental, international and regional organisations gathered at the week-long conference to develop a consensus on the most appropriate road map for revitalizing Kenya’s agricultural sector, which remains the bedrock of this country’s economy. ILRI directors and senior staff from other centres belonging to the Consultative Group on International Agricultural Research participated in this high-level Kenya conference. They presented research results at plenary sessions, backstopped discussion fora with scientific data and analyses, and—in an exhibit booth adjacent to the conference hall—disseminated research products to participants. The President, Vice-President and attending Ministers of Kenya all carried away ILRI’s poverty maps and other publications that provide essential information for broad-based and equitable development. Kenyan VIP Conference His Excellency the President of Kenya, President Mwai Kibaki, stops at the exhibit table of the International Livestock Research Institute to pick up Kenyan poverty maps and other ILRI research products from Ms Beatrice Ouma when the President opened Kenya’s ‘National Conference on Revitalizing the Agricultural Sector for Economic Growth’, held at the Safari Park Hotel from 20–24 February 2005.

Where are the poor in Uganda?

The first high-resolution poverty maps of Uganda are published to speed pro-poor development in that country. Uganda has some of the poorest people in the world. For the first time, the question Where are the poor in Uganda? can be answered, as a result of sophisticated poverty maps developed by the Uganda Bureau of Statistics and the International Livestock Research Institute (ILRI). These maps provide facts and figures on poverty and inequality by region, district and county, highlighting where the poorest are located and estimating the numbers of poor and levels of poverty. These maps are important because they can be used to ensure that resources are targeted at those most in need. This will avoid a 'shotgun' approach that can ultimately result in failure to reach the poorest, and inadvertently benefit the non-poor.

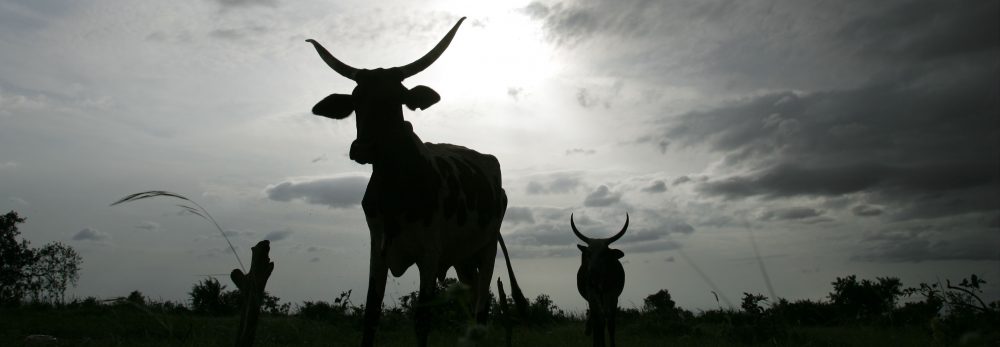
Snapshot: Uganda Uganda, located in eastern Africa, has an estimated population of 25.3 million and an annual population growth rate of 2.7%. The country has been plagued by an on-going 18-year-old war in the north between the government and rebel fighters. The rebels have become notorious for their crimes against civilians and for the abduction and murder of children. This has resulted in about 20,000 displaced persons, many of whom live in government 'internally displaced' camps. Over a million women and children have been affected. Children too afraid to sleep at night for fear of being abducted by rebels during their dawn raids on villages leave their homes each evening. They have become known as the 'night commuters' of northern Uganda – travelling from their villages to the safety of towns to avoid capture. Although this paints a bleak picture, Uganda as a whole has made great strides, taking advantage of significant growth in the 1990s and is considered a model of development in Africa. Crippling inflation rates have been brought under control and GDP growth has been impressive, at 7.9% in 1999 and with a projected growth rate of 6.2% in 2005. Agriculture is the most important sector of the economy, contributing over 32% of GDP and employing over 80% of the work force. Uganda's principal export is coffee, along with fish, fish products, cotton and tea. Despite Uganda's progress and concerted poverty reduction efforts, poverty is still widespread, with an estimated 38% of the population living below the national poverty line. The latest figures show the average life expectancy of a Ugandan is 43 years (47 years in 1990), infant mortality is 83 per 1000 live births, and under-5 mortality is 141 per 1000 children. The annual number of births is 1.3 million, but an estimated 184,000 children under 5 die each year. (Data sources: World Bank; UNICEF.)

Poverty mapping Until now, poverty statistics for Uganda have masked wide differences and revealed little about where the poor are located and where the greatest poverty reduction efforts should be concentrated. Newly released poverty maps present poverty and inequality estimates for Uganda's four regions, 36 districts, and 100+ counties. The maps also highlight changes that have taken place between 1992 and 1999. The maps show that poverty levels vary widely between and within regions, districts and counties. Encouragingly, the results show that more than 90% of Uganda's rural counties have estimated poverty levels that were lower in 1999 than in 1992. Of these, 29% experienced declines of between 0 and 30%. Most of the declines were in Uganda's western, central and eastern regions, while only a few counties in northern Uganda experienced the decline. The northern region also remained the poorest, with over 75% of the population classified as poor in 1999. Establishing exactly where the poor are located is a crucial first step to help target poverty reduction strategies at those most in need. As the authors agree, poverty maps and tables provide information while also raising more questions. Poverty mapping is nevertheless becoming an increasingly valuable tool in identifying ways to improve living standards of the poor, because the maps can be used to help design and implement pro-poor development strategies that are both effective and inclusive. Poverty is complex and multifaceted. There is no one universally agreed definition of poverty, and due to its complexity, no one indicator can measure all the dimensions of poverty simultaneously. Efforts concentrate on a few dimensions, such as income and consumption, and rely on many different data collection efforts. To obtain rich qualitative data and further insights, different data sets can be combined. For example, when poverty maps showing where the poor are located are used in combination with budget, socioeconomic, environmental and other information, the maps become a rich source of information for development planning and policy formulation. Most importantly, more precise geographic targeting of pro-poor expenditures can maximize the coverage of the poor while minimizing leakage to the non-poor. Poverty maps and tables also facilitate budget allocation and allow the distribution of central government resources according to the prevalence of poverty in different areas. Policymakers will be armed with more transparent evidence, and will be able to more accurately target public resources and service delivery. Changes in poverty in Uganda between 1992 and 1999 The results from the analysis of poverty changes are encouraging, with large and widespread decreases in poverty seen countrywide. The authors warn that these trends should be viewed as indicative only. Cautious interpretation of the 1999 estimates is required due to the relatively small number of households surveyed in the panel. The 1999 maps are being updated, making use of new census data. Some of the results show: The highest drops in poverty in rural areas between 1992 and 1999 were in central and parts of western regions in the districts of Kibaale, Luwero, Bushenyi, Rakai, Mpigi and Kisoro. Poverty increased in Arua, Moyo and Apac in the northern region and Kasese District in the western region. At the county level, almost all rural areas in Uganda benefited from the growth that took place during the 1990s. Poverty worsened in 8% of Uganda's rural counties. Increasing inequality was observed in the northern region and some districts in the western region including Masindi, Kasese and Bundibugyo. There are pockets of high poverty levels, but these are spread over the different regions and occur in both rural and urban areas. Poverty rates were greatest in the least secure areas of the northeast and northwest and parts of the eastern region. Some small areas ('hotspots') with very high numbers of poor people also occur in many areas of Uganda. The highest poverty density was in counties in Mbale District (eastern region) and Kisoro District (western region). High densities were also observed in counties in Kasese (western region), Masaka (central region), Kampala (central region) and Tororo (eastern region). The central region stood out as the least poor region in 1992 and 1999 for both rural and urban areas. The district-level poverty incidence (that is the percent of the population falling below the relevant poverty line) ranged from 31 to 64% in 1992. The poorest district was Mubende, with more than 64% of its rural population living below the poverty line. Kampala District stood out as the wealthiest district with only 15% of its population living below the poverty line. The eastern region has a population of 3.7 million in rural areas and 0.3 million in urban areas. This region had the widest variation in poverty levels, with Jinja District having the lowest poverty (38%) in 1992 while Kumi had the highest at 82%. County-level variations were even higher. The northern region, with over 75% of the population poor in 1992, remained the poorest region in Uganda in 1999. The poorest districts were Kotido and Kitgum, with poverty incidences of 91%, while Arua and Lira stood out as the least-poor districts. There was significantly more variation in poverty in this region at both the district and county levels. The western region ranked the second least-poor in Uganda. More than one-half of the rural population and one-third of the urban population lived below the poverty line in 1992. Rural poverty was highest in Kisoro and lowest in Mbarara districts. In 1999 there was considerable variation in poverty incidence in this region. Masindi, Bundibugyo and Kasese had greater than 50% poverty incidence, whereas relatively wealthy districts such as Mbarara and Bushenyi had poverty levels below 20%.